
Page 1197 - Xmo Strata - Bulletin Archive
P. 1197
Health, Safety & Environmental Bulletin No 448
29 January 2015
2014 Safety Performance
As part of our regular monitoring of our H&S performance we analyse our statistics for trends.
As you will be aware, the more hazards that we identify, the less likely we are to suffer injury or
property damage and the more we eliminate or reduce, the less likely others will suffer either fate and
the less chance our clients will be pursued by a no-win-no-fee lawyer or a genuine or spurious claim.
We recently amended our Accident Triangle format to identify our leading versus lagging indicator
performance.
A leading indicator is a positive hazard spot or safety observation that demonstrates vigilance and
enables us or our client to make it safe and prevent an accident from happening. The more hazards we
identify and make safe, the less likely we are to have an accident.
A lagging indicator is a hazard that hasn’t been identified or addressed and leads to either property
damage or an accident.
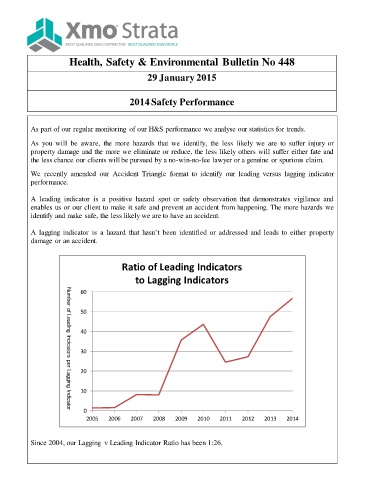
Ratio of Leading Indicators
to Lagging Indicators
60
50
40
30
20
10
0
Number of Leading Incicators per Lagging Indicator
2005 2006 2007 2008 2009 2010 2011 2012 2013 2014
Since 2004, our Lagging v Leading Indicator Ratio has been 1:26.